Data Charts
I built these charts with data using Google Sheeets.
You may also like

Music Database Presentation
2018
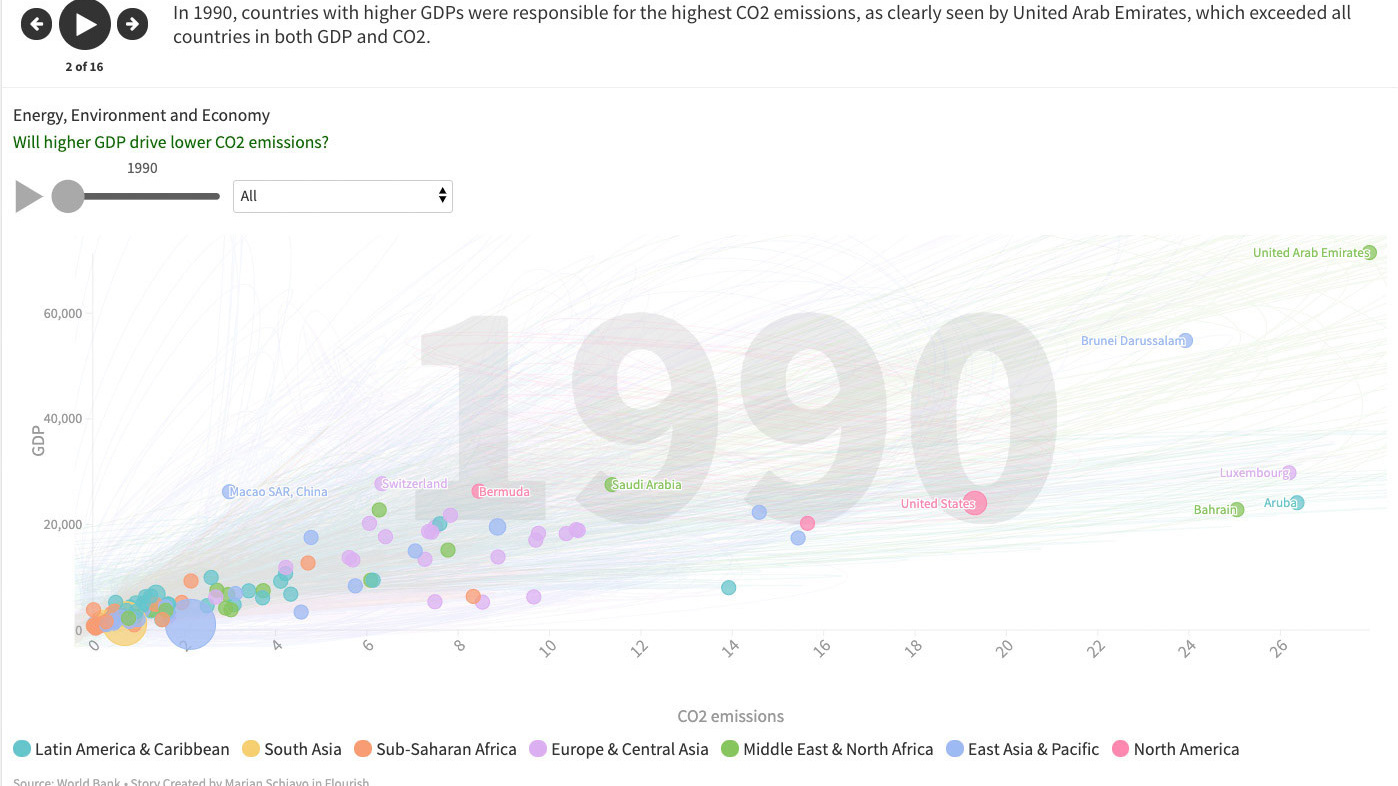
Population, GDP and CO2 Emissions (1990- 2014)
2019
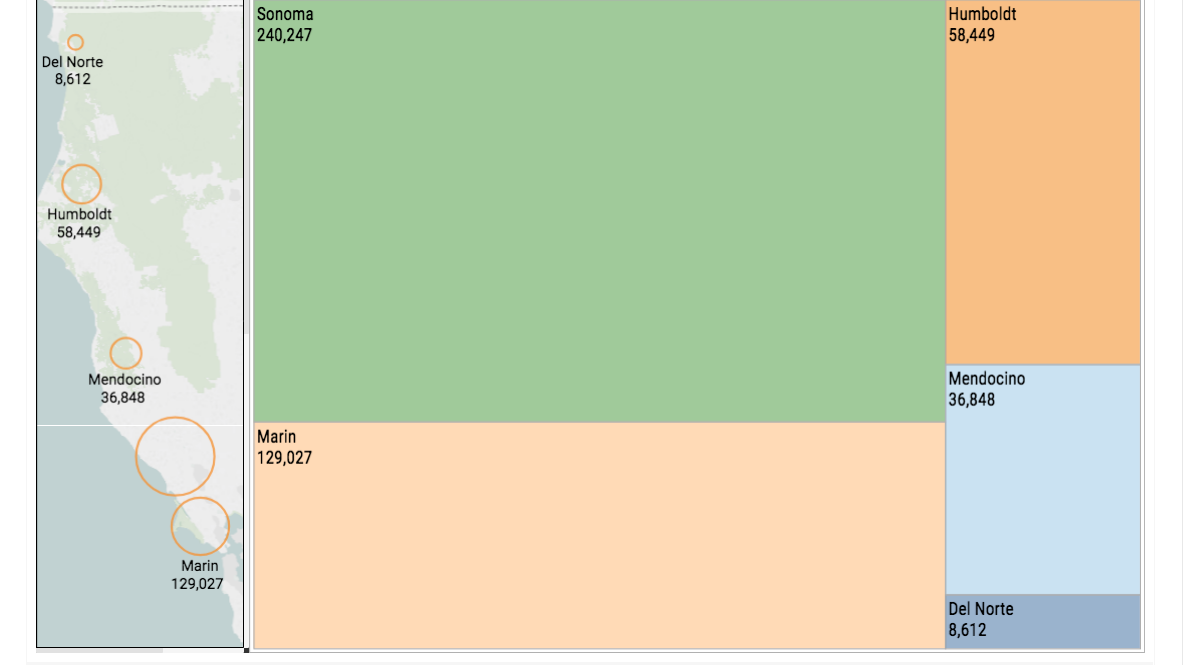
Story
2019
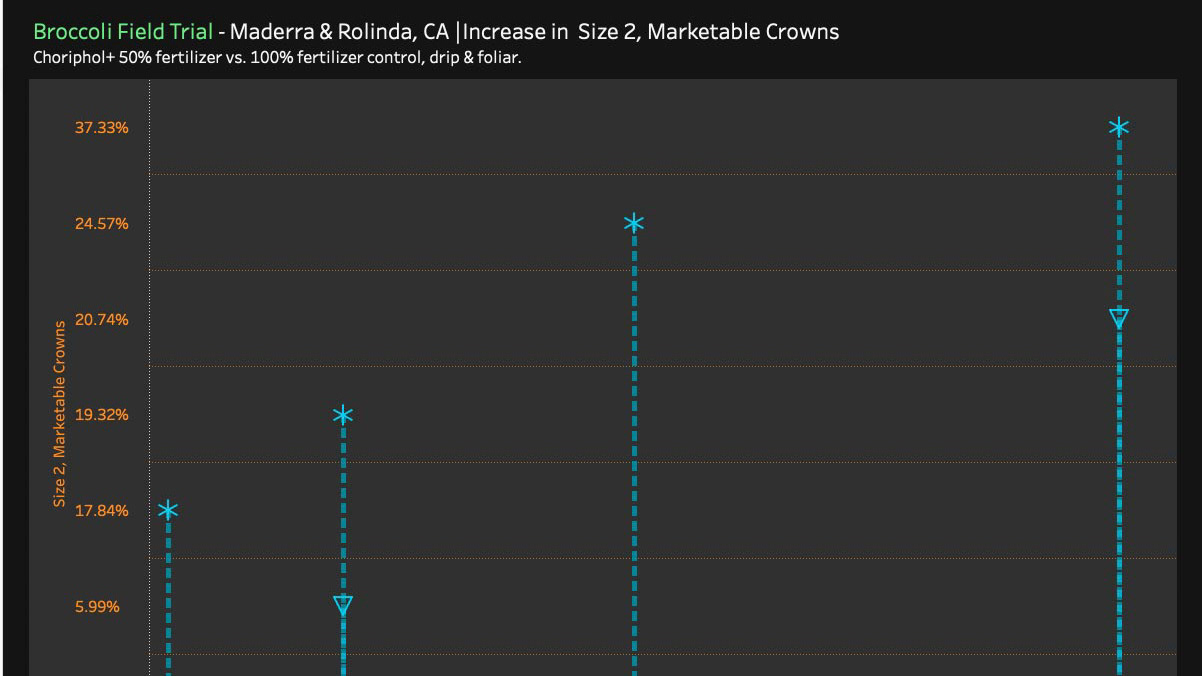
Data Dashboards
2019
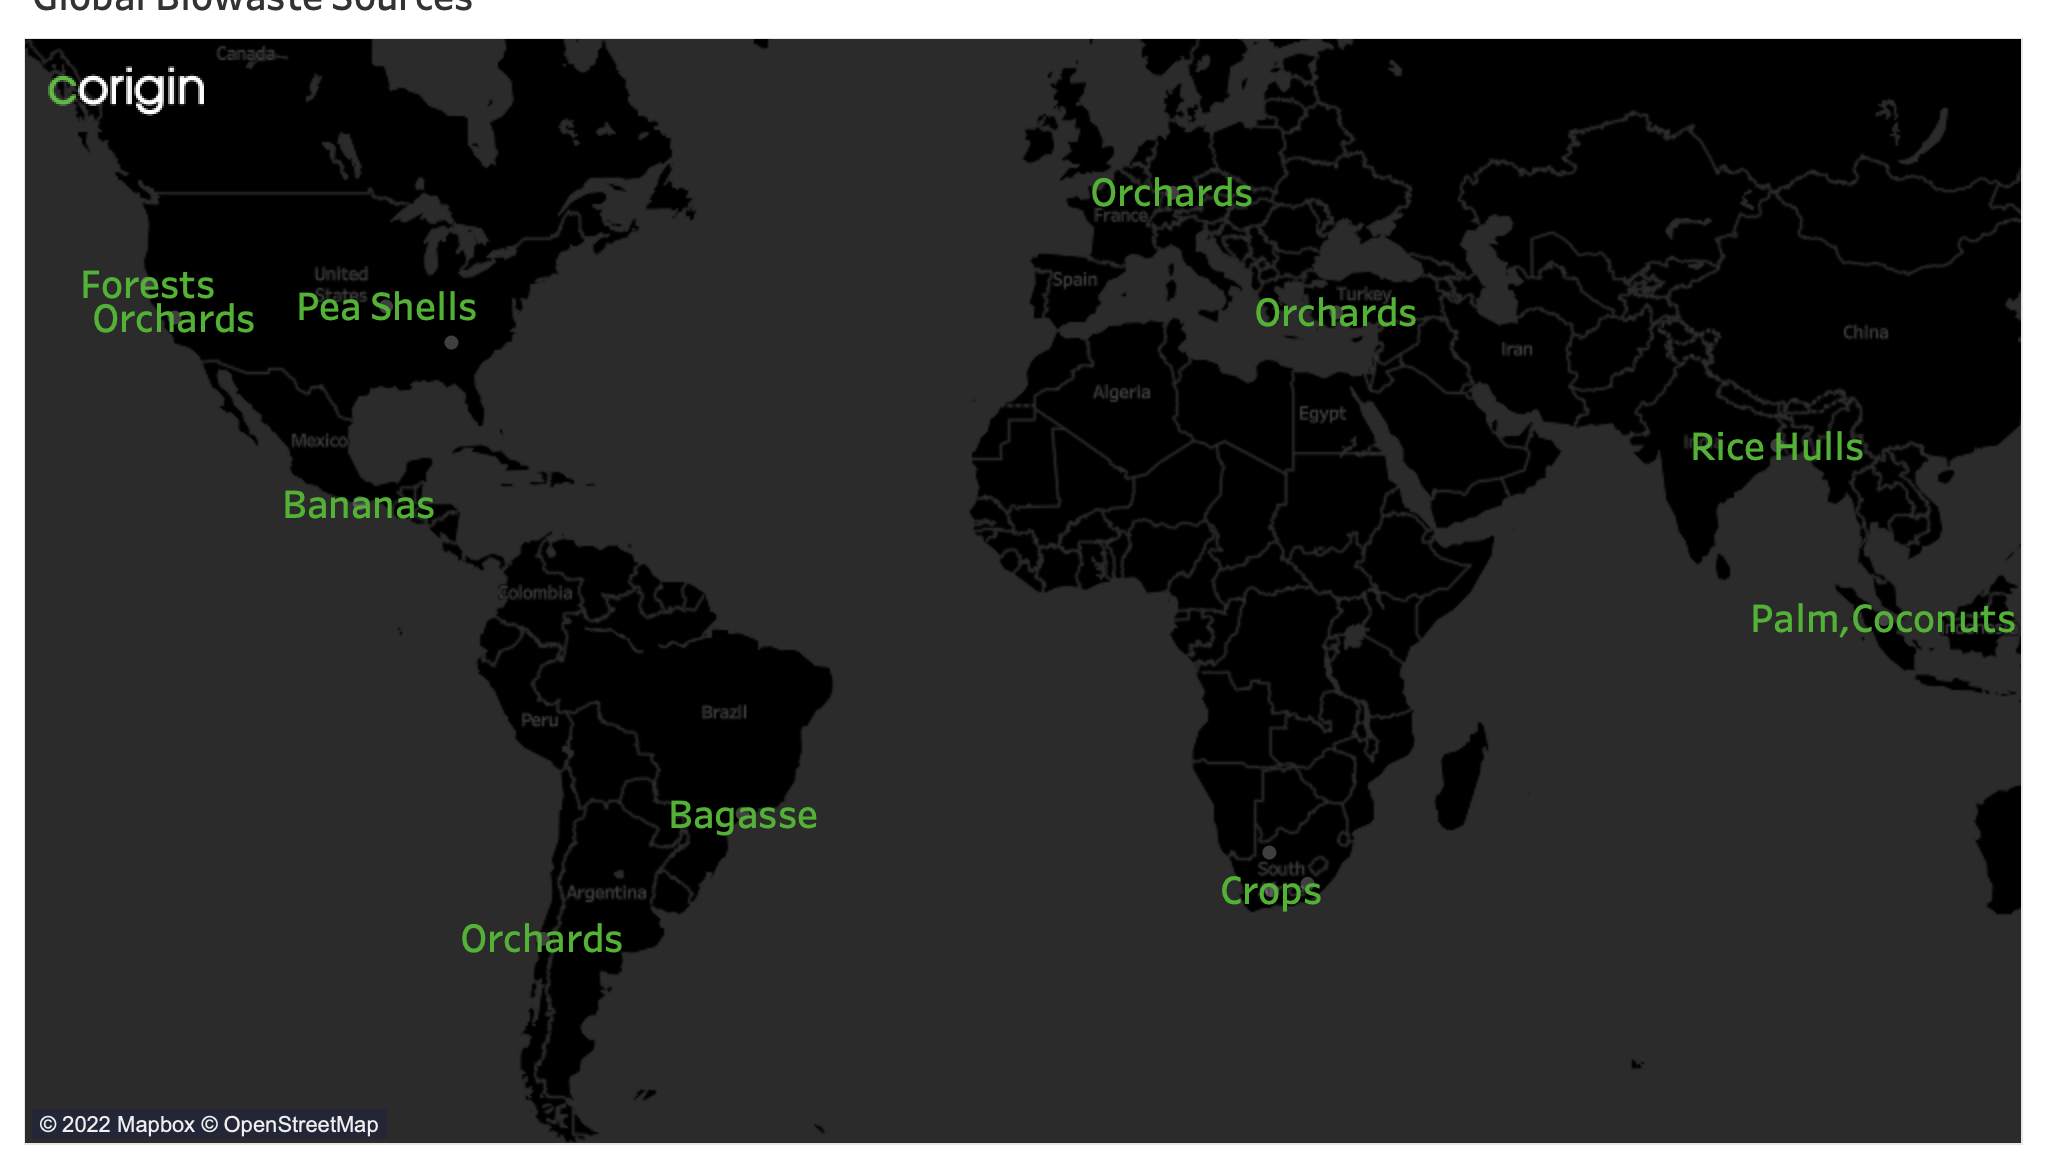
Global Biowaste Sources
2022
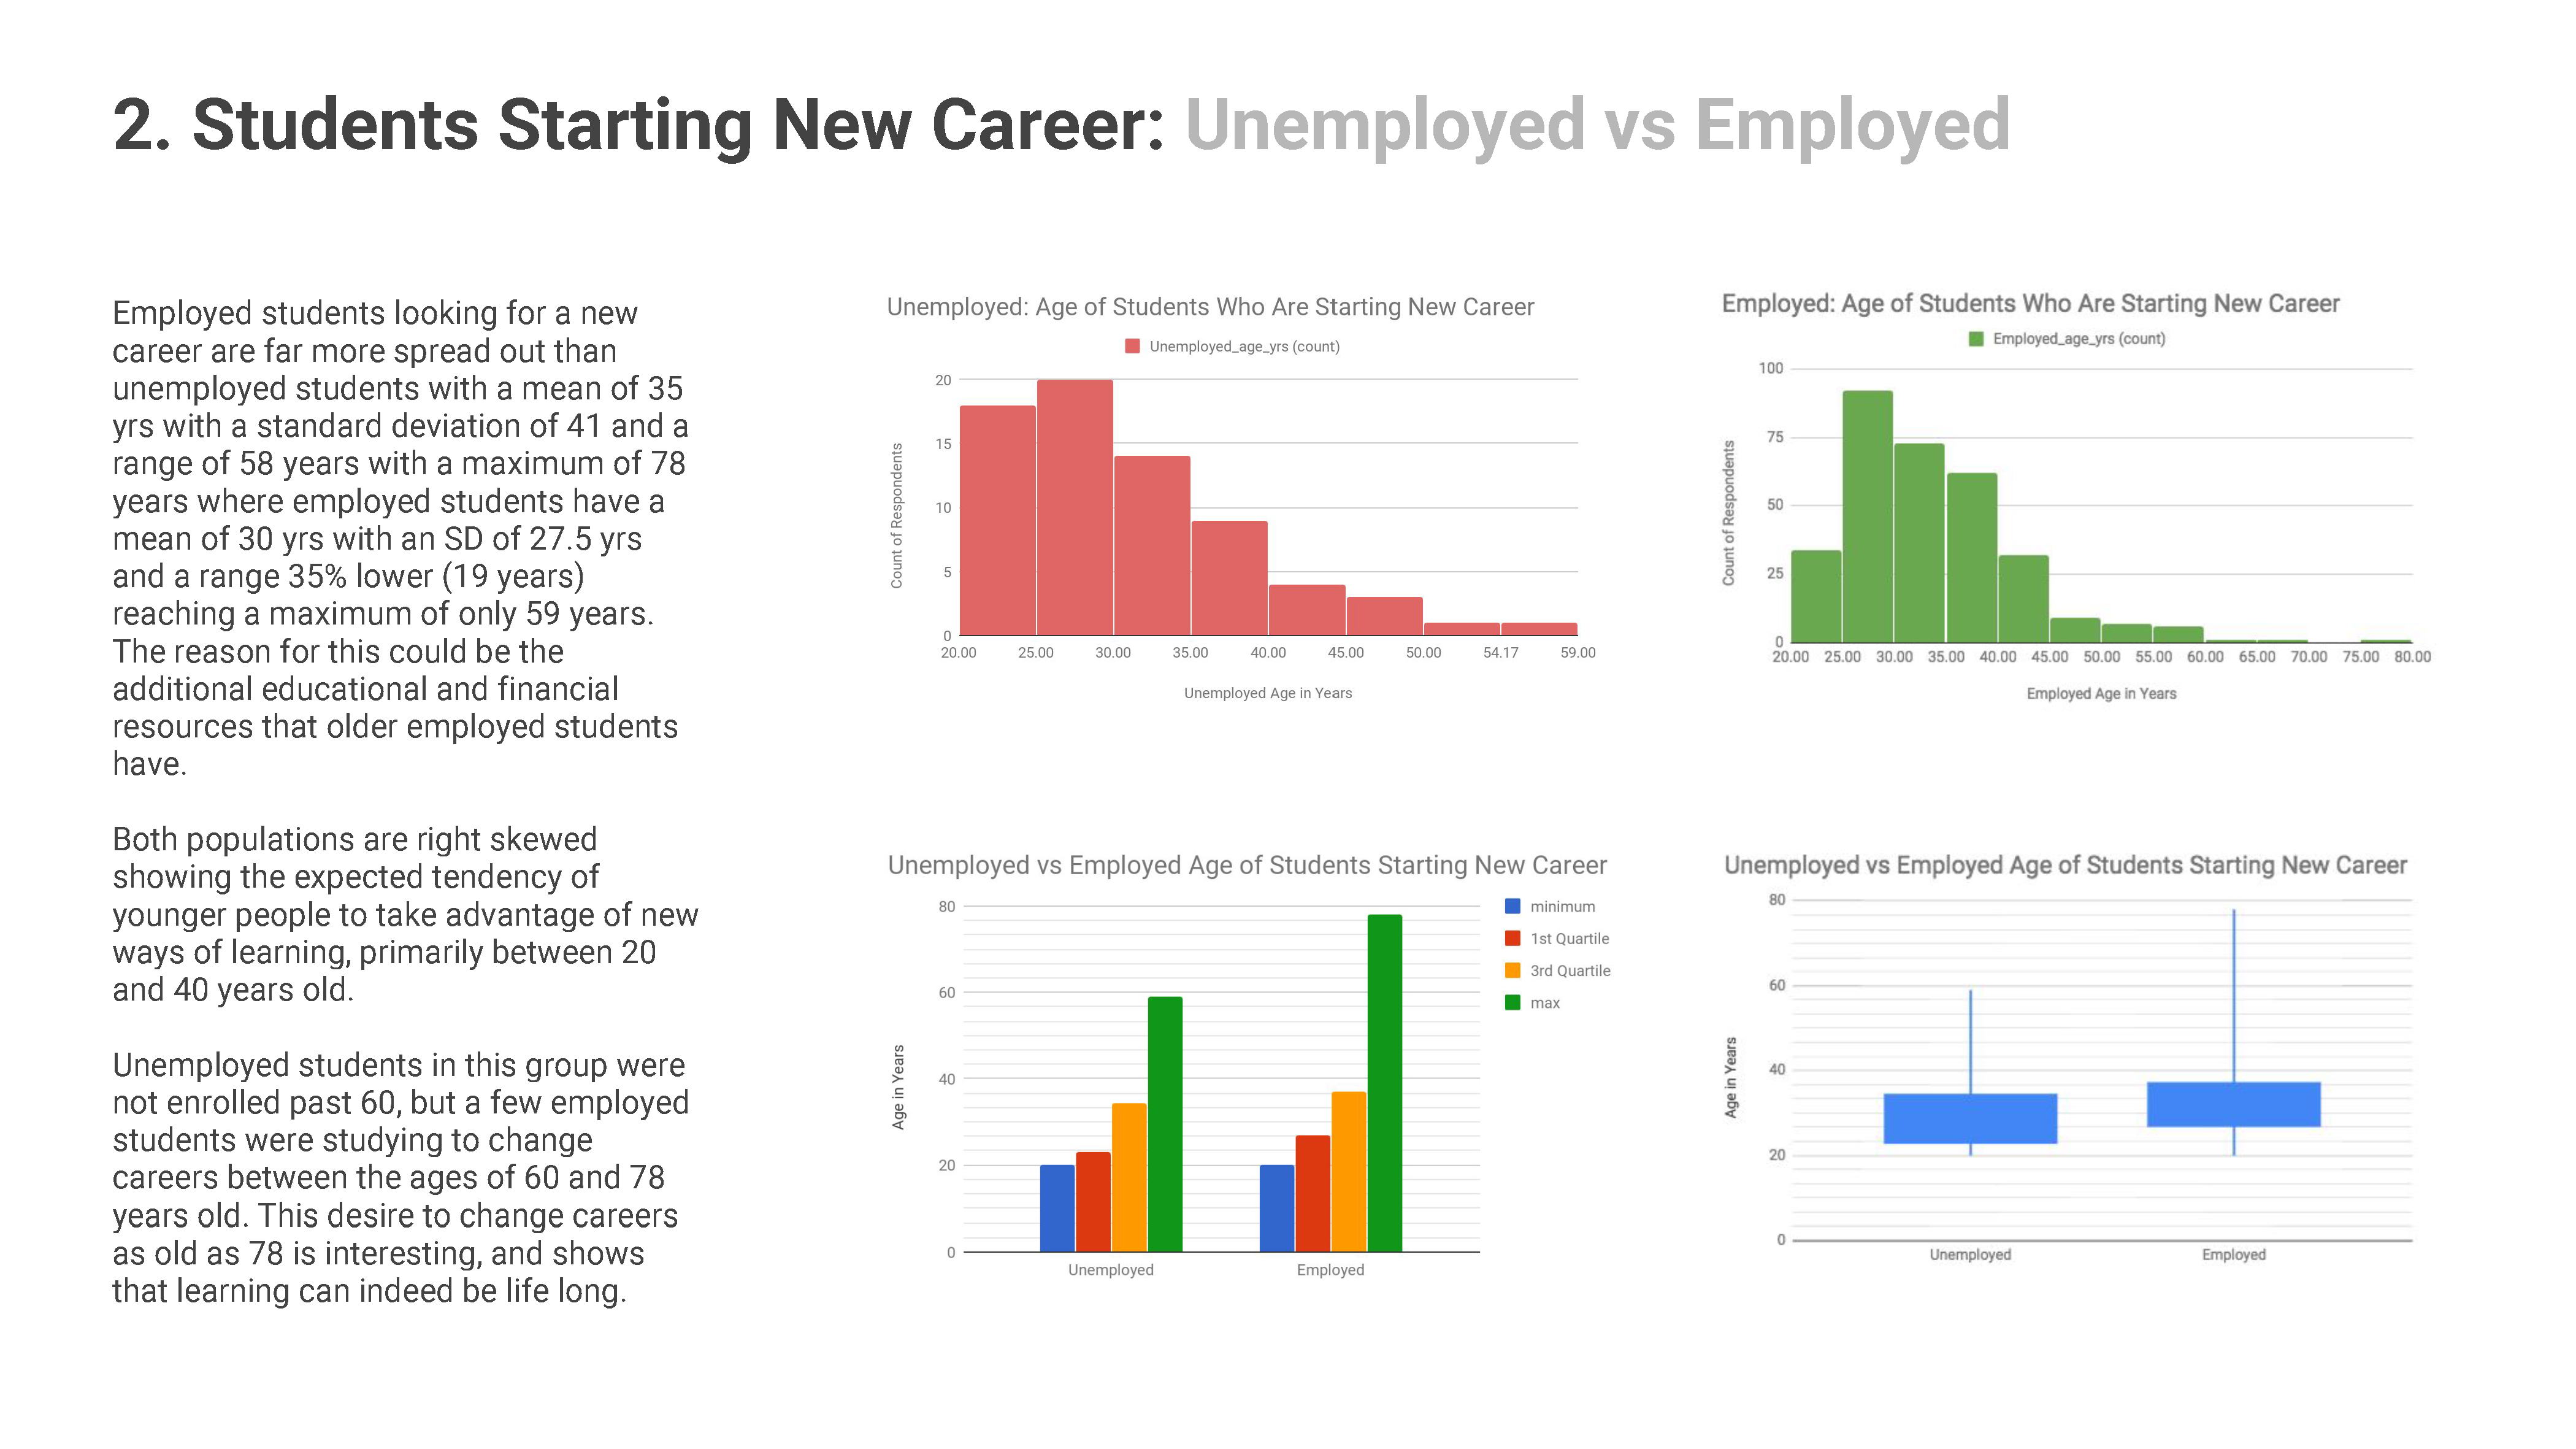
Data Analysis Insights and Presentation
2018

N. Coast Economic Disparity Report 3
2018
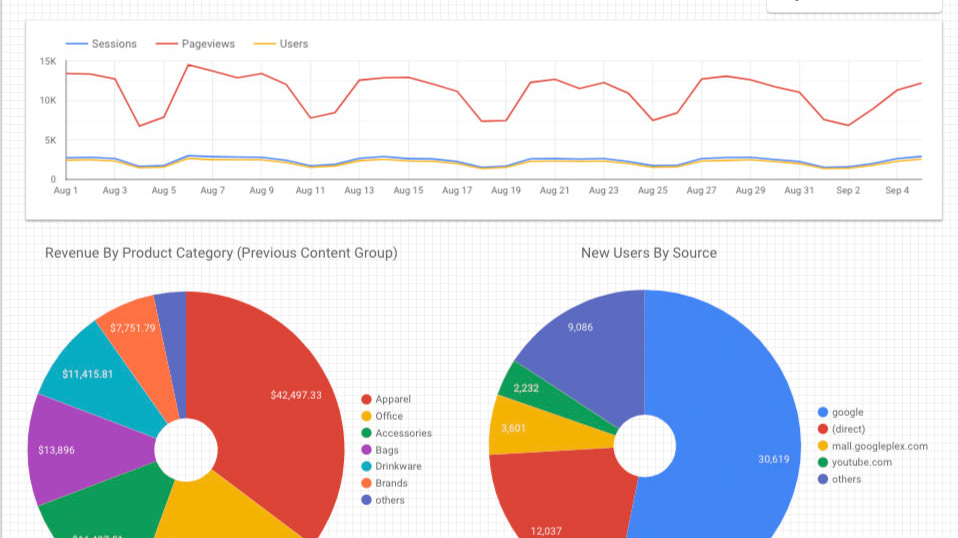
Google Analytics Dashboard
2019
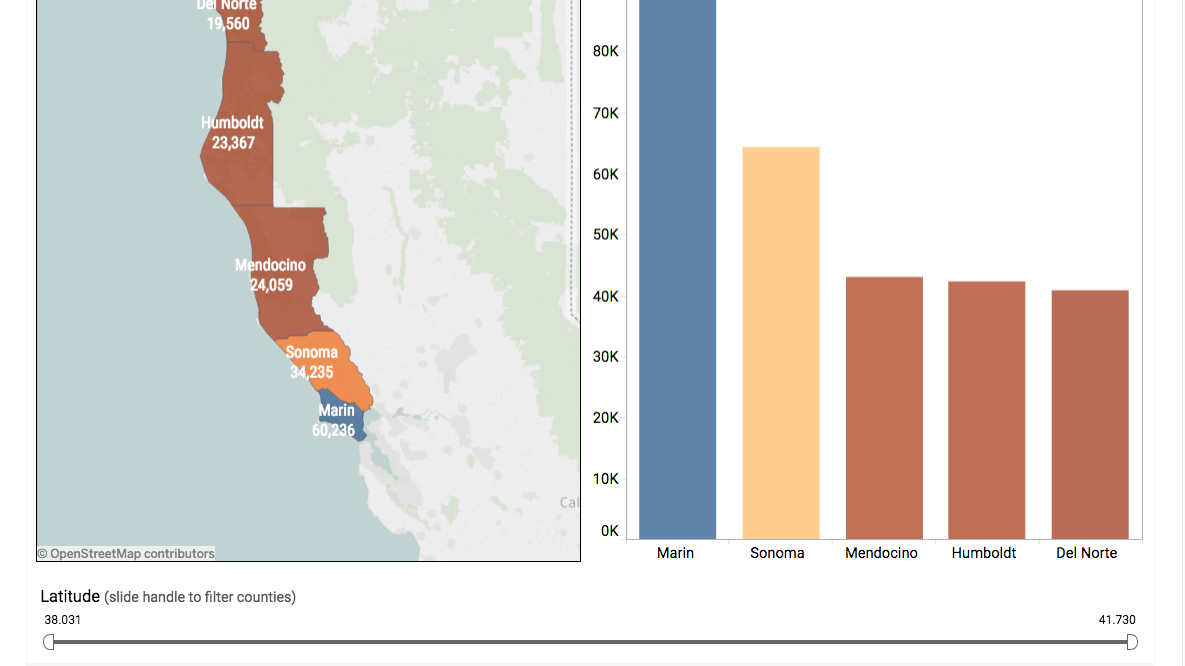
N. Coast Economic Disparity Report 2
2019
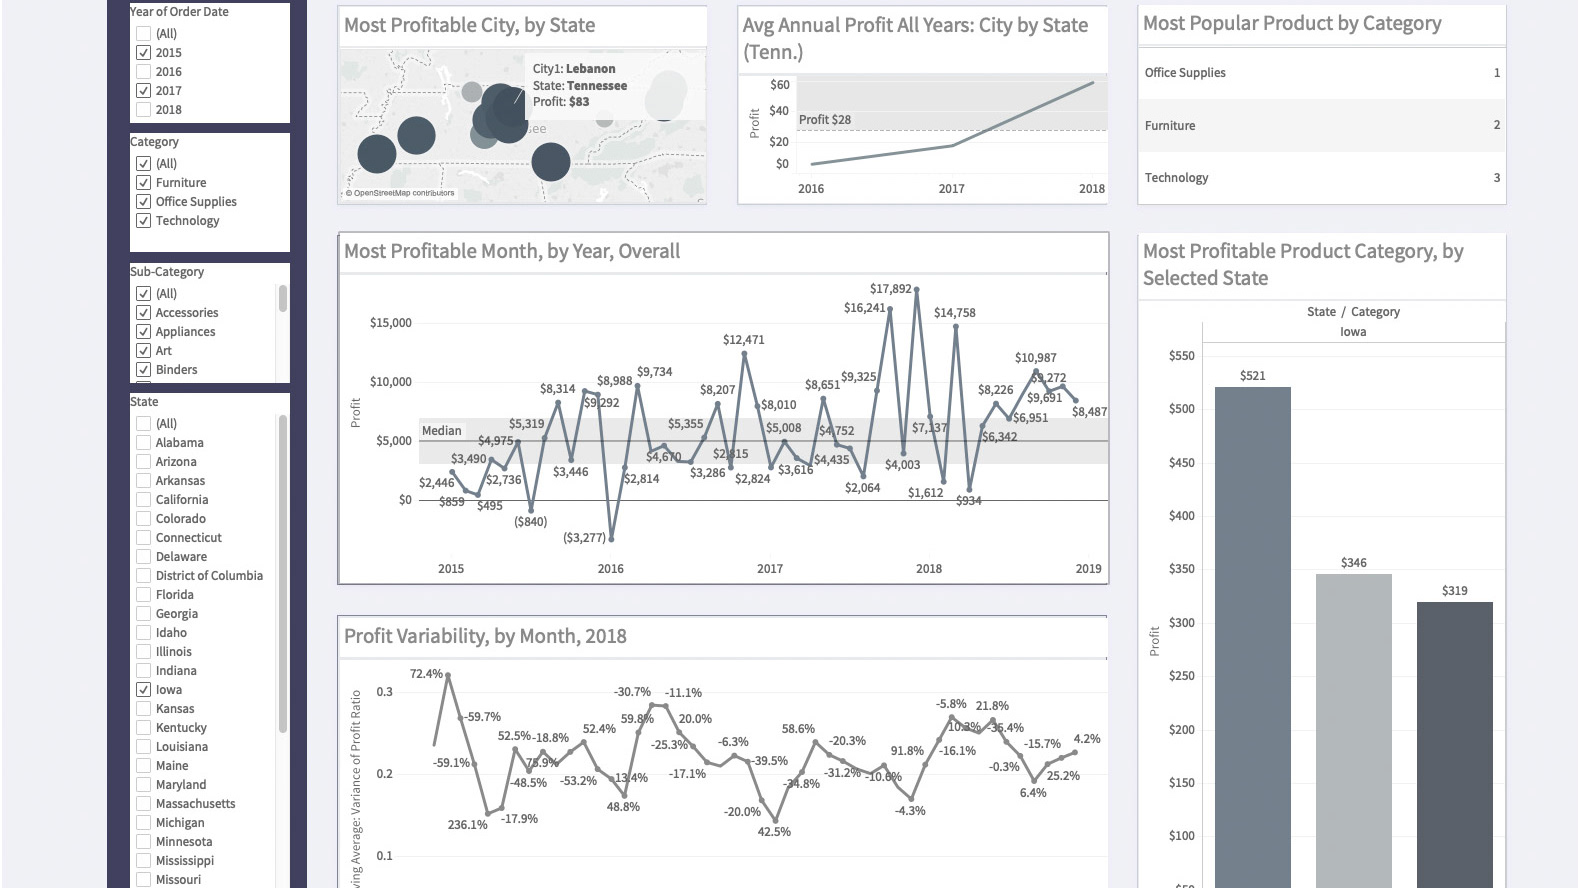
SuperStore_Proof of Concept
2019