N. Coast Economic Disparity Report 3
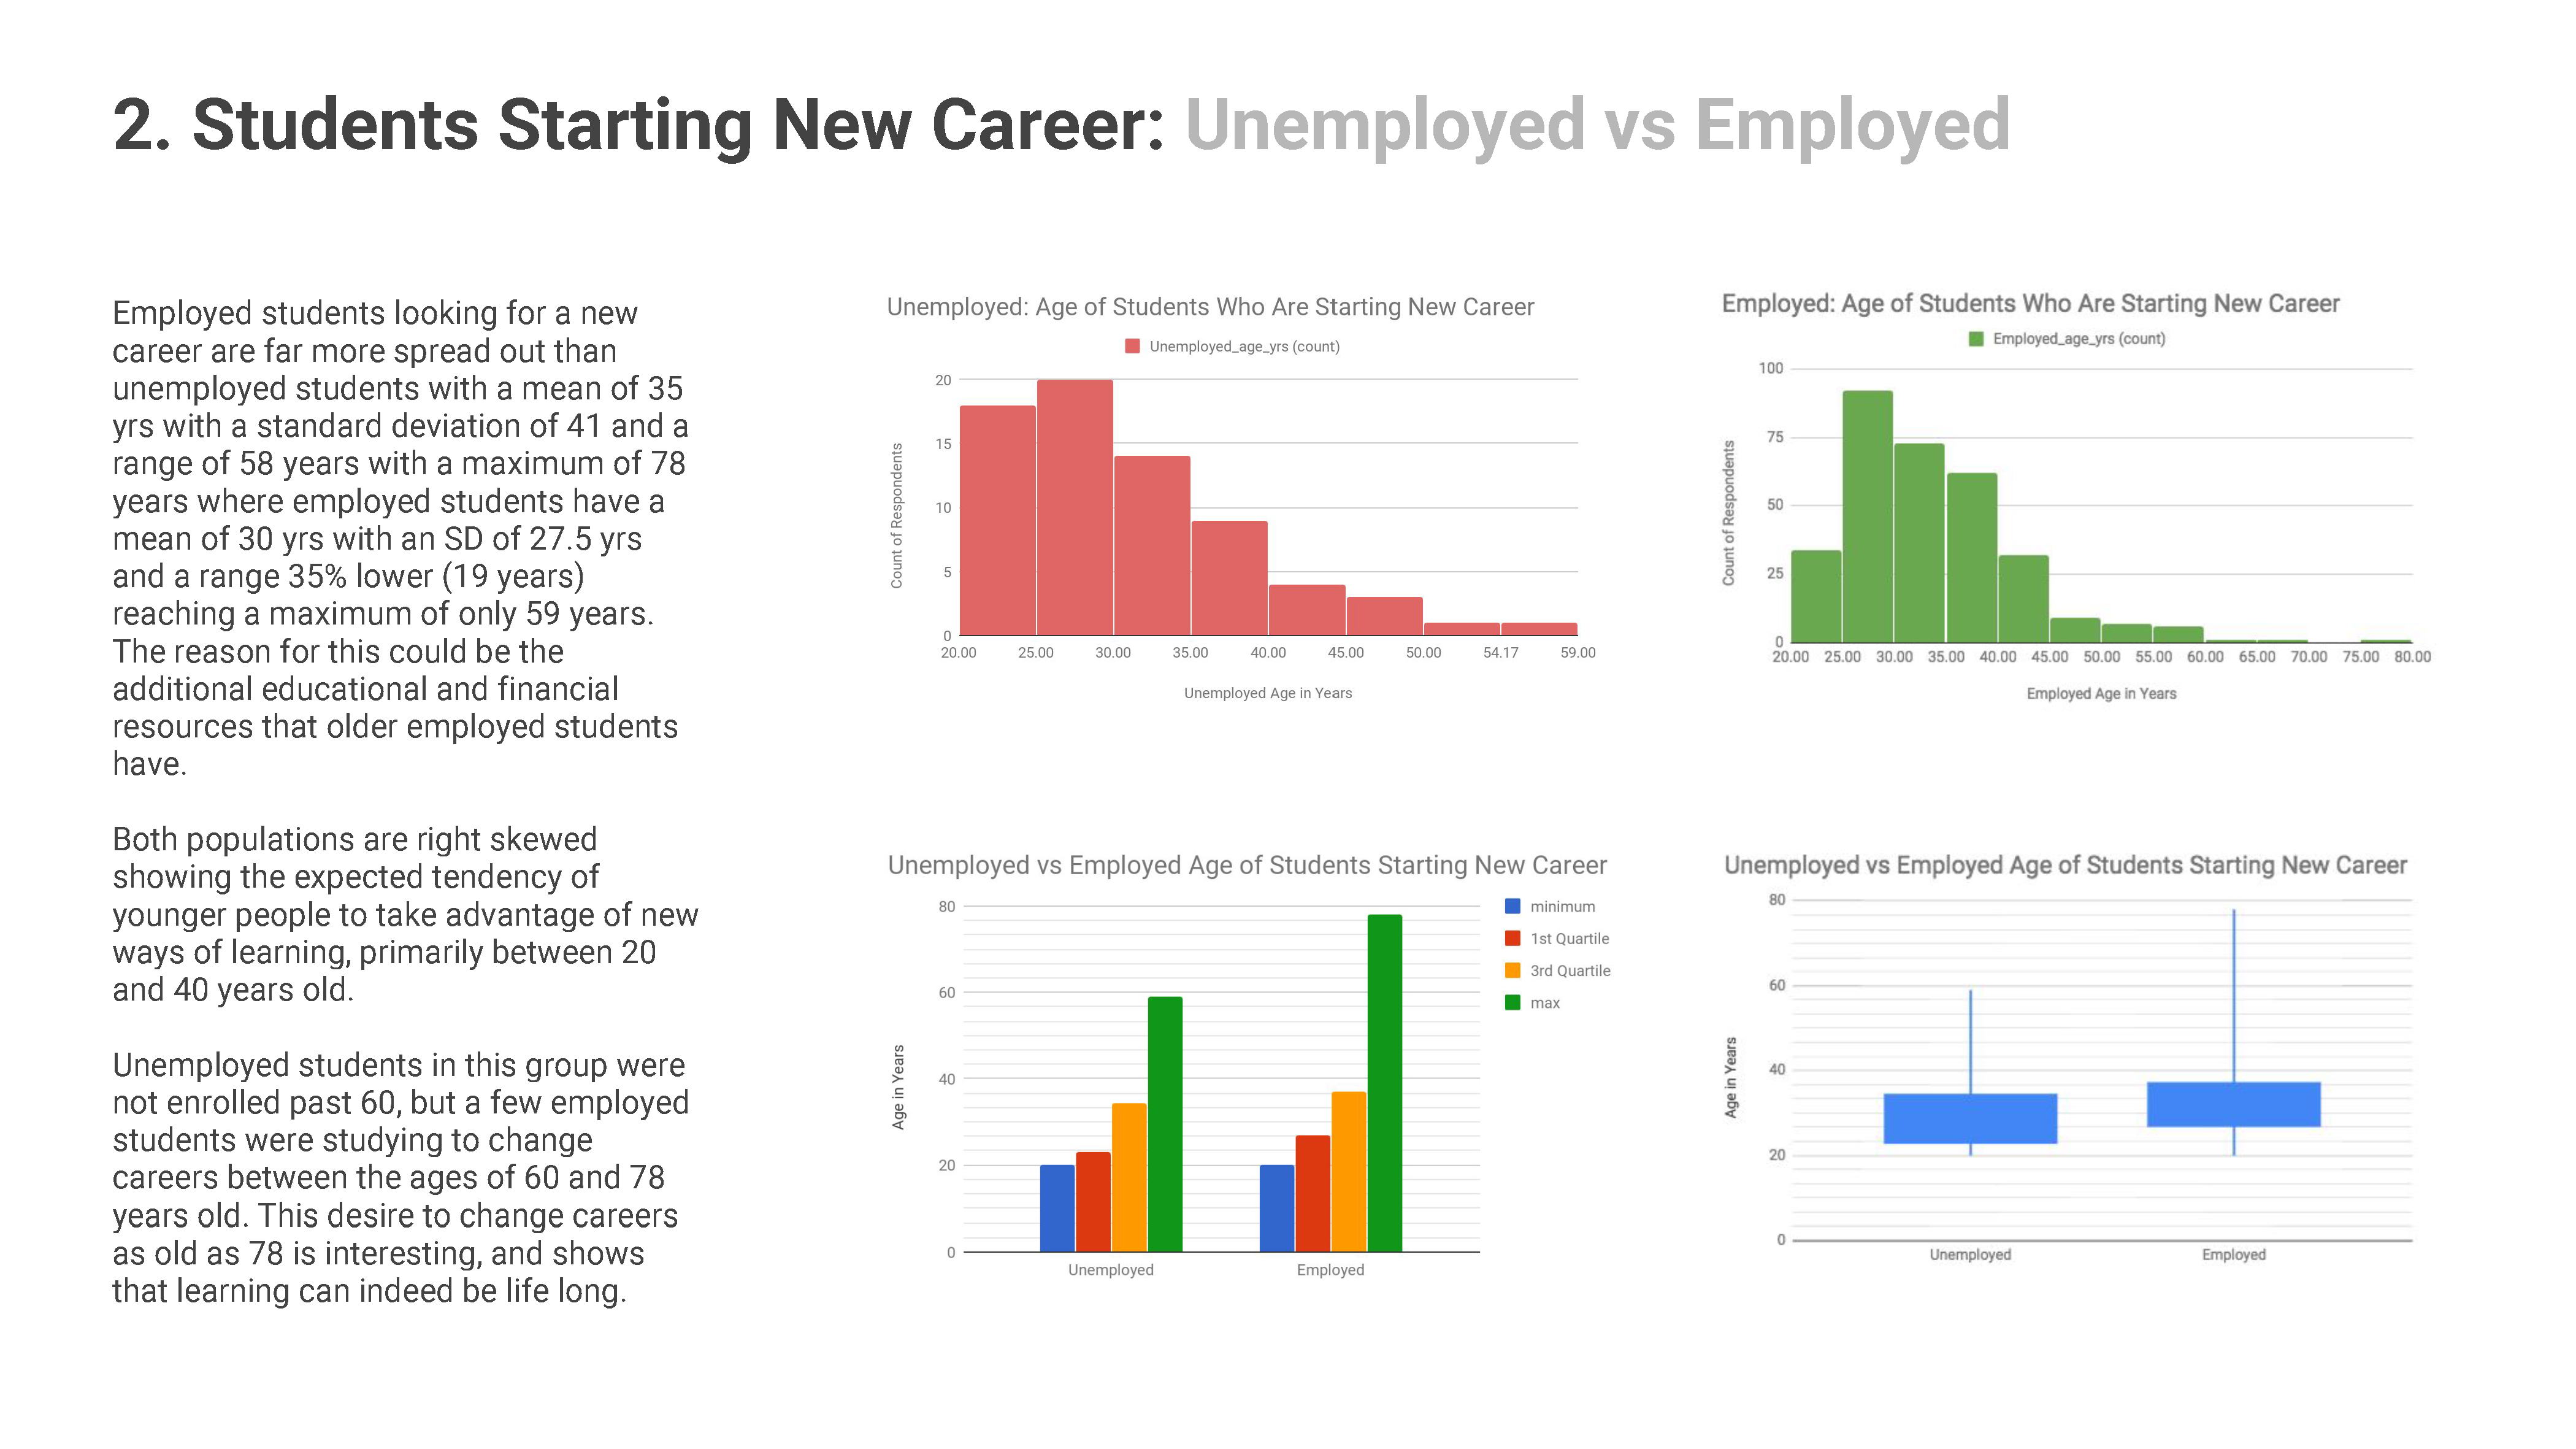
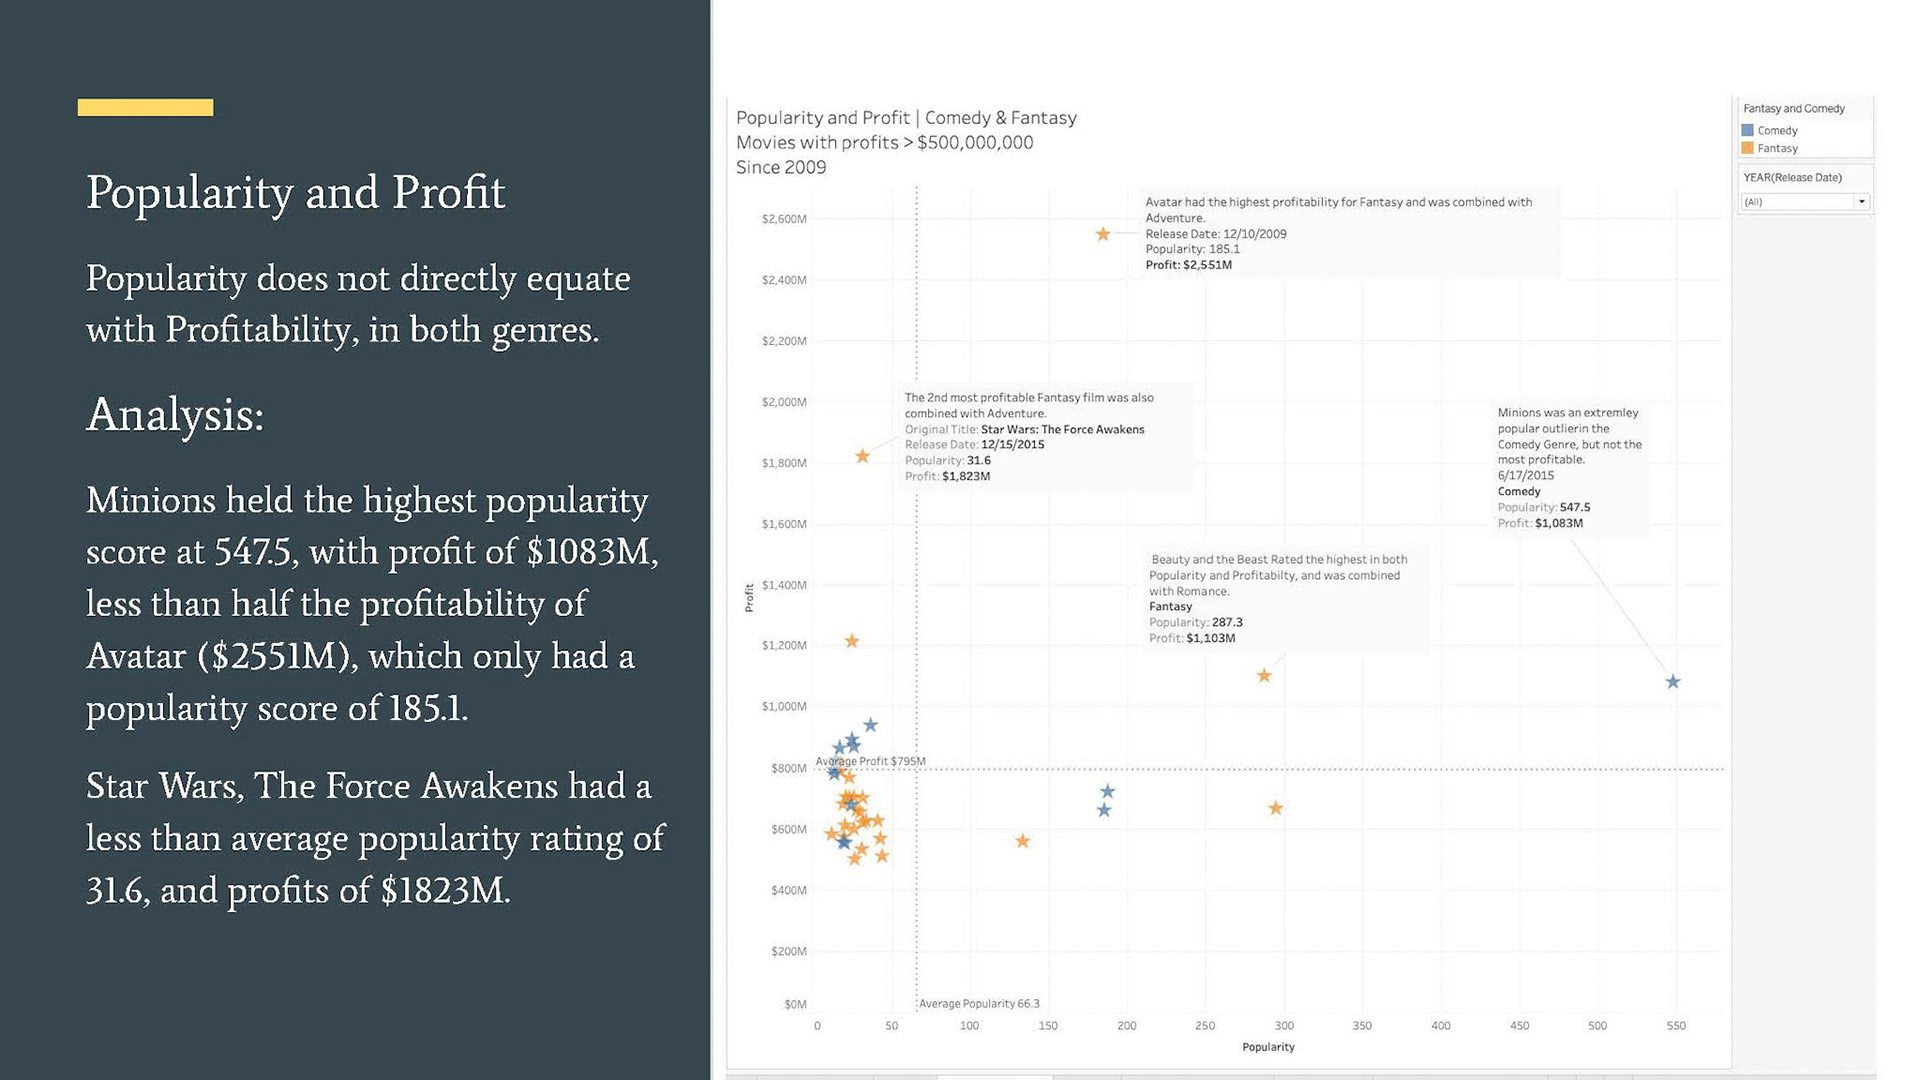
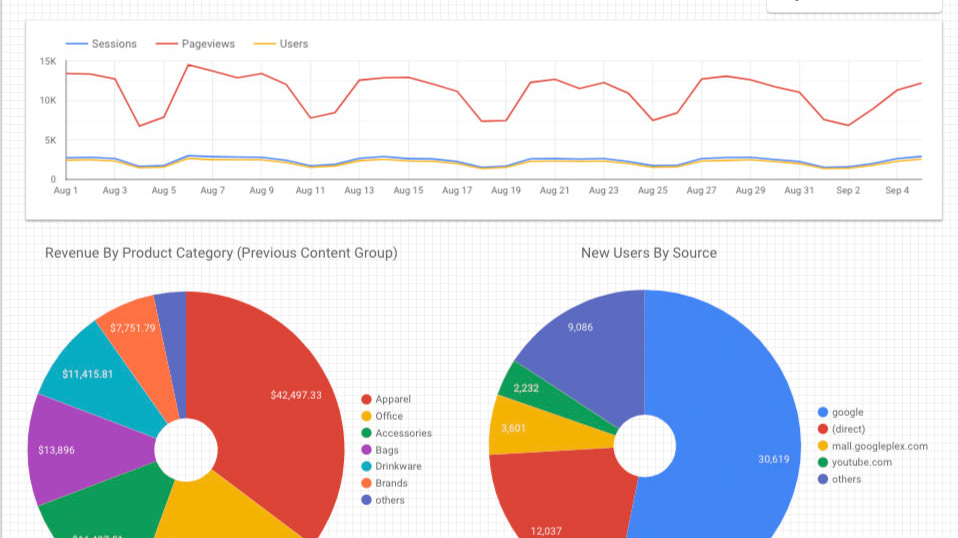
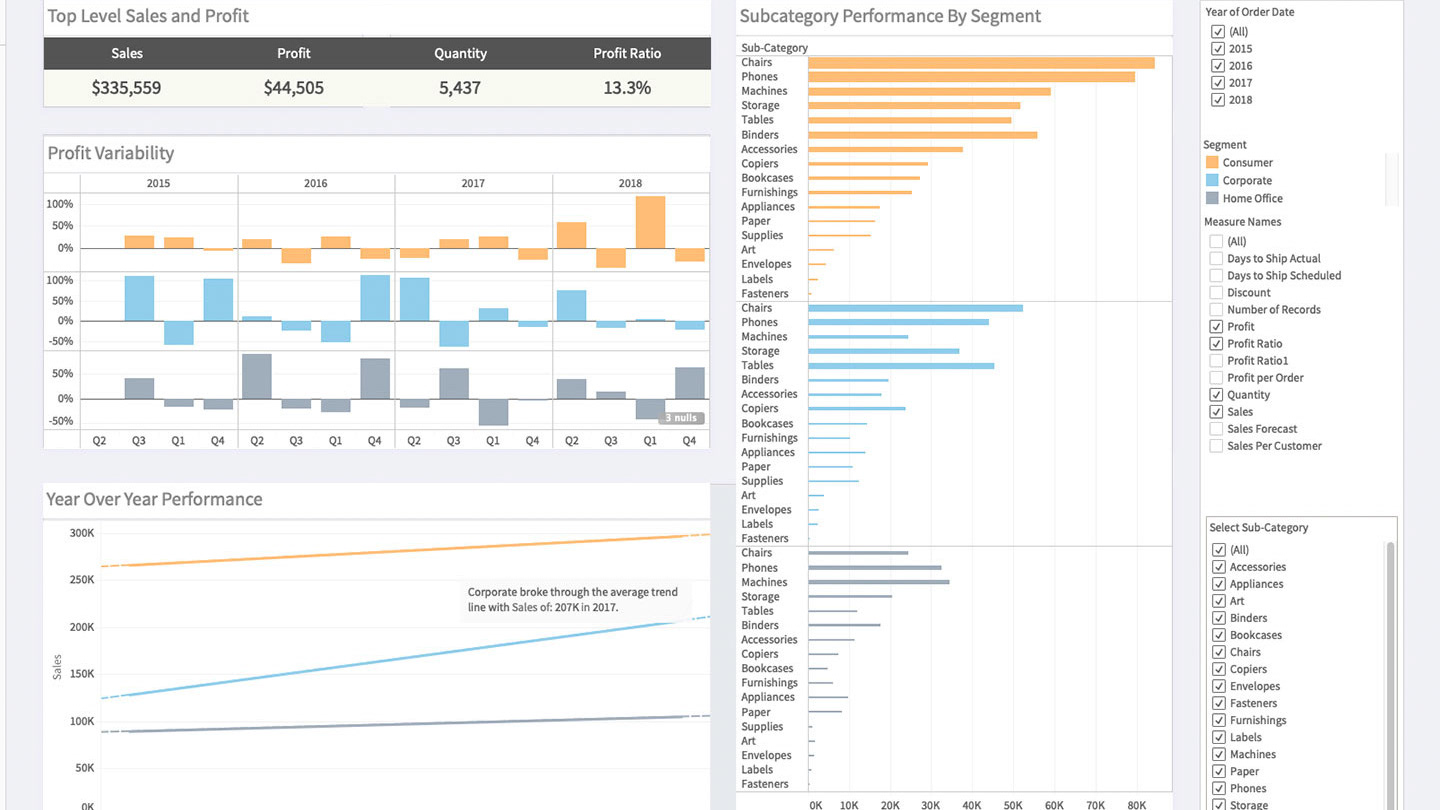
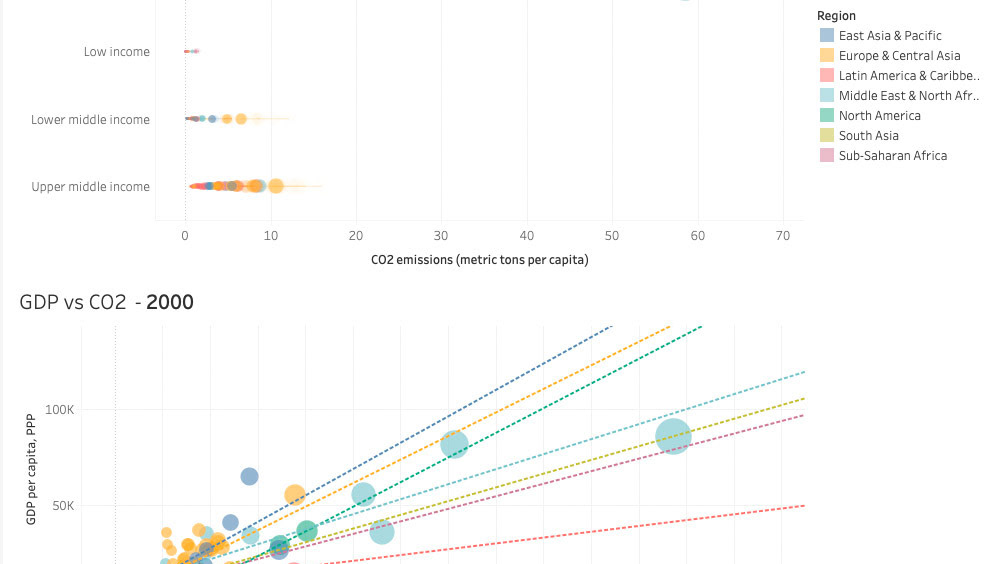
Live interactive data dashboard: I used SQL, Google Sheets for data aggregation and gleaning insights, then Tableau for data design and story narrative.
You may also like

Data Analysis Insights and Presentation
2018

Movie Production Analysis | Tableau Data Story
2020
North Coast Economic Disparity - A Data Story
2018

Devlin iBook Personal Section
2015

Google Analytics Dashboard
2019

SuperStore Sales: Proof of Concept 2
2019

Data Charts
2019

Data Dashboards
2019

Simple Illustrations
2001

Energy, Environment, Economy, Tableau Data Story
2019